An Introduction to
|
|
This page summarizes a few basic things regarding 16S ribosomal RNA gene analysis. The actual mechanics of the various parts of this test can be found elsewhere on the web or in an up-to-date textbook, and they may be summarized here in the future. With this comparative test, differences in the DNA base sequences between different organisms can be determined quantitatively, such that a phylogenetic tree can be constructed to illustrate probable evolutionary relatedness between the organisms.
The nucleotide base sequence of the gene which codes for 16S ribosomal RNA is becoming an important standard for the definition of bacterial species. Comparisons of the sequence between different species suggest the degree to which they are related to each other; a relatively greater or lesser difference between two species suggests a relatively earlier or later time in which they shared a common ancestor.
A comparison between eleven species of gram-negative bacteria is illustrated on a separate sequence comparison page, where the sequences are aligned such that similarities and differences can be readily seen when one scrolls to the right or left. Gaps and insertions of nucleic acid bases (the result of "frame-shift" mutations occuring over eons of time as the organisms diverge from common ancestors) which affect long stretches of DNA have to be taken into account for a proper alignment.
In an earlier version of the above-mentioned sequence comparison page, when only four species were compared with each other, a relatively short segment stood out as appearing to be "frame-shifted" when comparing Pseudomonas fluorescens with a group of three enterics. This situation is shown as follows with the nucleotide bases of the segment in question shown in red.
| Pseudomonas fluorescens | ...gctaataccgcatacgtcctacgggagaaagcagggg... |
| Our new organism, shown below as "AH" |
...gctaataccgcataacgtcgcaagaccaaagcggggg... |
| Budvicia aquatica | ...gctaataccgcgtaacgtcgaaagaccaaagcggggg... |
| Edwardsiella tarda | ...gctaataccgcataacgtcgcaagaccaaagtggggg... |
One can surmise that a frame-shift mutation – if the bases are not misplaced to the extent that the mutation becomes silent or lethal – could be a "cheap" way to effect a major change in the genotype and subsequent phenotype – perhaps resulting in one of those infamous "leaps" in evolution one hears conjectured about from time to time. Even though the specific sequence within a shifted segment of DNA may not be changed, the shift will result in the nucleotide bases being re-grouped into different triplet codes and read accordingly, and the resulting gene may produce a vastly different protein which can change the appearance or function of a cell to a significant extent. So, when sequences between two species are compared, the organisms may appear to be a bit more closely related if these relatively short frame-shifted segments were taken into consideration. (With long stretches of DNA, one would not expect independant genes farther along the chromosome to be affected.)
When a 1308-base stretch of that part of the chromosome which codes for 16S ribosomal RNA was lined up and analyzed ("manually" when I had a little time to kill) to find the extent to which the above four organisms differed from each other, the percent difference between any two organisms was determined, and the results are summarized as follows:
| PF | PF | |||
| AH | 14.8* | AH | ||
| BA | 14.5 | 3.2 | BA | |
| ET | 14.9 | 4.3 | 5.0 | ET |
| * An example: The same bases appear in the same sequence, position by position, for each of the two organisms except for 14.8% of the time. | ||||
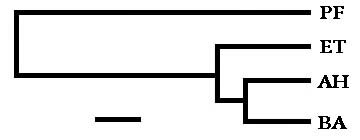
With the percent differences used to denote probable evolutionary distances between the organisms, a phylogenetic tree was roughed out to illustrate the relationships. The distances between any two organisms, when read along the horizontal lines, corresponds closely to the percent differences. (The bar at the bottom signifies approximately 1% base difference.)
Databases of various gene sequences are found on the web. Genbank's database was used as the source of the above sequences. And rather than having to line up the sequences and determine the differences manually, a set of programs to analyze sequence data and plot trees are available; an example is provided here.
In checking the web for background information for this page, I came upon Frameshift by science-fiction writer Robert J. Sawyer which turned out to be an immensely satisfying science-based mystery novel.
| GO TO: |
" 16S rRNA gene comparisons " Site Outline of related pages |
These general microbiology pages have copyright by John Lindquist |
|