Dilution Theory – Page 3:The Most Probable Number Method |
|
||||
|
|||||
 A downloadable copy of this hard-to-find paper is
 |
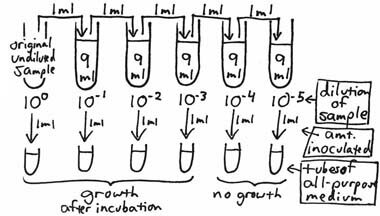
To envision the theoretical basis for the Most Probable Number (MPN) Method, think of a ten-fold dilution series being made of a water sample with one ml of each dilution being inoculated into a separate tube of an all-purpose broth medium.
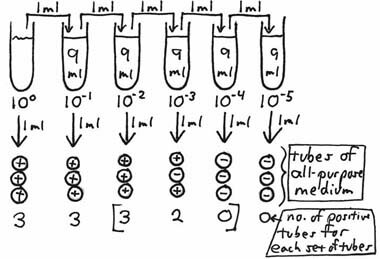
After incubation, the broth tubes are observed for the presence or absence of growth. Theoretically, if at least one organism had been present in any of the inocula, visible growth should be seen for that particular tube. If the broth inoculated from the 10–3 dilution shows growth, but the broth from the 10–4 does not, it is then possible to say that there were greater than 1X10³ organisms per ml of the original sample but less than 1X10⁴ per ml. Bacteria are rarely, if ever, distributed evenly in a sample. For example, if a 10 ml sample contains a total of 300 organisms, not every one ml aliquot (a good term to know the correct definition of; look it up!) will contain 30 organisms; some will contain more or fewer, but the average of all ten aliquots in the entire 10 ml sample will be 30. This also applies to any of the dilution tubes from which inocula are taken. To increase the statistical accuracy of this type of test, more than one broth tube can be inoculated from each dilution. Standard MPN procedures use a minimum of 3 dilutions and 3, 5 or 10 tubes per dilution. The statistical variability of bacterial distribution is better estimated by using as many tubes as possible or practical. After incubation, the pattern of positive and negative tubes is noted, and a standardized MPN Table is consulted to determine the most probable number of organisms (causing the positive results) per unit volume of the original sample. In the following example, a set of 3 tubes of an all purpose broth medium is inoculated from each of the ten-fold dilutions, with each tube being inoculated with one ml.
After incubation, the number of tubes showing growth is recorded. As the succeeding dilutions were made, the organisms were diluted to such an extent that none were in the inocula of seven of the tubes (marked negative). In order to estimate the number of organisms per ml of the sample which would cause this kind of growth response, we locate the three sets of tubes which show dilution of the organisms "to extinction" – i.e., those tubes which were inoculated from the 10–2, 10–3 and 10–4 dilutions. The Neapolitan ice cream-colored table running along the right-hand side of the screen is the 3-tube MPN Table we have been using in our courses for decades (original source unknown). The heading of the last column tells us that this combination of results (in order: 3-2-0) suggests an average of 0.93 organisms being inoculated into each of the tubes of the middle set (of the three sets of tubes chosen) – i.e., those inoculated with one ml of a 10–3 dilution. Therefore, the most-probable number of organisms per one ml of the original, undiluted sample would be 0.93 X 10³ or 9.3 X 10². A 5-tube MPN table can be found by clicking here. This method, with the associated table, only works if there is a succession of 1/10 dilutions being tested (in an appropriate medium) for growth, and the tubes chosen to compare with the table are in consecutive order of increasing dilution. Some things to keep in mind:
Here are a couple examples of MPN problems.I. (This is based on a problem from Bacteriology 102.) From a water sample obtained from beautiful Lake Splammo, you inoculated 10 ml into 90 ml of sterile diluent; this is the "first dilution" indicated in the table below. After thorough mixing, 1 ml of this dilution was added to 99 ml of sterile diluent, and a third dilution was made the same way. From each of these dilutions, tubes of Glucose Fermentation Broth were inoculated with amounts as shown in the table below. After appropriate incubation, the tubes were checked for growth and acid production, and the data are summarized below. |
|||||||||||||||||||||||||||||||||||||||||||||||||||||||||||||||||||||||||||||||||||||||||||||||||||||||||||||||||||||||||||||||||||||||||||||||||||||||||||||||||||||||||||||||||||||||||||||||||||||||||||||||||||||||||||||||||||||||||||||||||||||||||||||||||||||||
What was the most probable number of glucose-fermenters per ml of the original sample of water? Here is one way of finding the solution:
An alternate (easier) method would be to multiply the MPN value from the table (0.43) by the dilution factor of the "D" set of tubes which is 104. The result is the same: 0.43 X 104 = 4.3 X 10³. II. (This is based on a problem from Bacteriology 324.) A sample of raw hamburger was divided aseptically, and weighed portions were added to flasks of enrichment broth utilized in the traditional FDA Salmonella isolation and identification procedure. The amounts utilized are indicated in the results table below. The entire FDA procedure was done from each flask, and the number of flasks from which confirmed isolates of Salmonella were obtained is indicated below.
Calculate the Salmonella count per gram of the hamburger.
Note that there are no dilutions made, but there are still decimally decreasing amounts of sample being inoculated. The smaller the number of organisms you expect, the less you want to dilute a sample. To "go in the opposite direction" from dilution, you need to take decimally larger portions of the undiluted sample as we have seen in this example. Here is a set of practice problems "for the general public" involving dilution plating and the MPN method. Solutions are given on a separate page. |
|||||||||||||||||||||||||||||||||||||||||||||||||||||||||||||||||||||||||||||||||||||||||||||||||||||||||||||||||||||||||||||||||||||||||||||||||||||||||||||||||||||||||||||||||||||||||||||||||||||||||||||||||||||||||||||||||||||||||||||||||||||||||||||||||||||||
GO
|
" Mike Curiale's MPN Calculator. |
These general microbiology pages have copyright by John Lindquist |